
Predicting dynamic behaviors is a central goal of science and is essential for applications ranging from business forecasting to policymaking. This work introduces an analytic approach that uses a sigmoid growth curve to model the dynamics of individual entities within complex systems. Despite nonlinearity and short-term unpredictability, the approach captures phases of acceleration and deceleration and can predict an entity’s ultimate state well in advance. We demonstrate the method using customer purchasing behavior and the adoption of concepts in U.S. legislation, enabling forecasts months to years ahead and revealing system-level structure from individual lifepaths.
Universal Lifepaths and Sigmoid Dynamics
Many complex systems contain entities whose activity begins gradually, accelerates, and then slows as constraints emerge—eventually saturating or ending. This recurring “lifepath” pattern can be captured by a sigmoid curve that summarizes the cumulative activity of an entity over time.
In this framework, each entity is described by three interpretable parameters: inflection time (when growth shifts from acceleration to deceleration), slope (how rapidly activity changes near the inflection point), and amplitude (the total lifetime activity). Tracking how these fitted parameters evolve as more data becomes available provides a practical way to characterize an entity’s current stage and forecast its future trajectory. Stabilization of parameters is a strong signal that the entity has passed its inflection point and is approaching saturation.
This work also uses parameter spaces—visualizations where each entity appears as a point defined by its fitted parameters—to reveal collective structure that is not visible from single trajectories alone.
Optional: If you want one short equation line (Squarespace can handle it as plain text), add this as its own paragraph:
y(t) = A / (1 + e^{-m(t − t0)})
Case Studies: Customers and Legislation
Customer purchasing behavior. Using order histories from an industrial customer dataset, the study shows that cumulative ordering trajectories can be well described by sigmoid curves. The fitted parameters enable forecasting of when a customer is likely to stop ordering and the expected total order volume. Parameter-space patterns separate one-time customers, medium customers, and long-lived repeat customers, helping identify entities with growth potential versus those approaching saturation.
U.S. legislation adoption (PFAS). The method is also applied to legislative dynamics by extracting named entities and key terms from PFAS-related bills. Usage of terms in proposed legislation exhibits nonlinear lifepaths that can be modeled by sigmoid fits, allowing identification of emerging concepts (inflection time in the future), slowing terms, and saturated terms—supporting forecasting of policy attention months to years ahead.
From Individual Dynamics to System-Level Insight
By describing individuals with a shared functional form, the approach connects micro-level lifepaths to macro-level system behavior. The parameter spaces and population distributions make it possible to detect stable regimes, compare system evolution across years, and assess whether system dynamics remain consistent or shift. This provides a general framework for prediction and interpretation across domains where entities exhibit nonlinear growth and decline.
Research
Leila Hedayatifar, Alfredo J. Morales†, Dominic E. Saadi, Rachel A. Rigg, Olha Buchel, Amir Akhavan, Egemen Sert, Aabir Abubaker Kar, Mehrzad Sasanpour, Irving R. Epstein, and Yaneer Bar-Yam. “Predicting System Dynamics of Universal Growth Patterns in Complex Systems.”
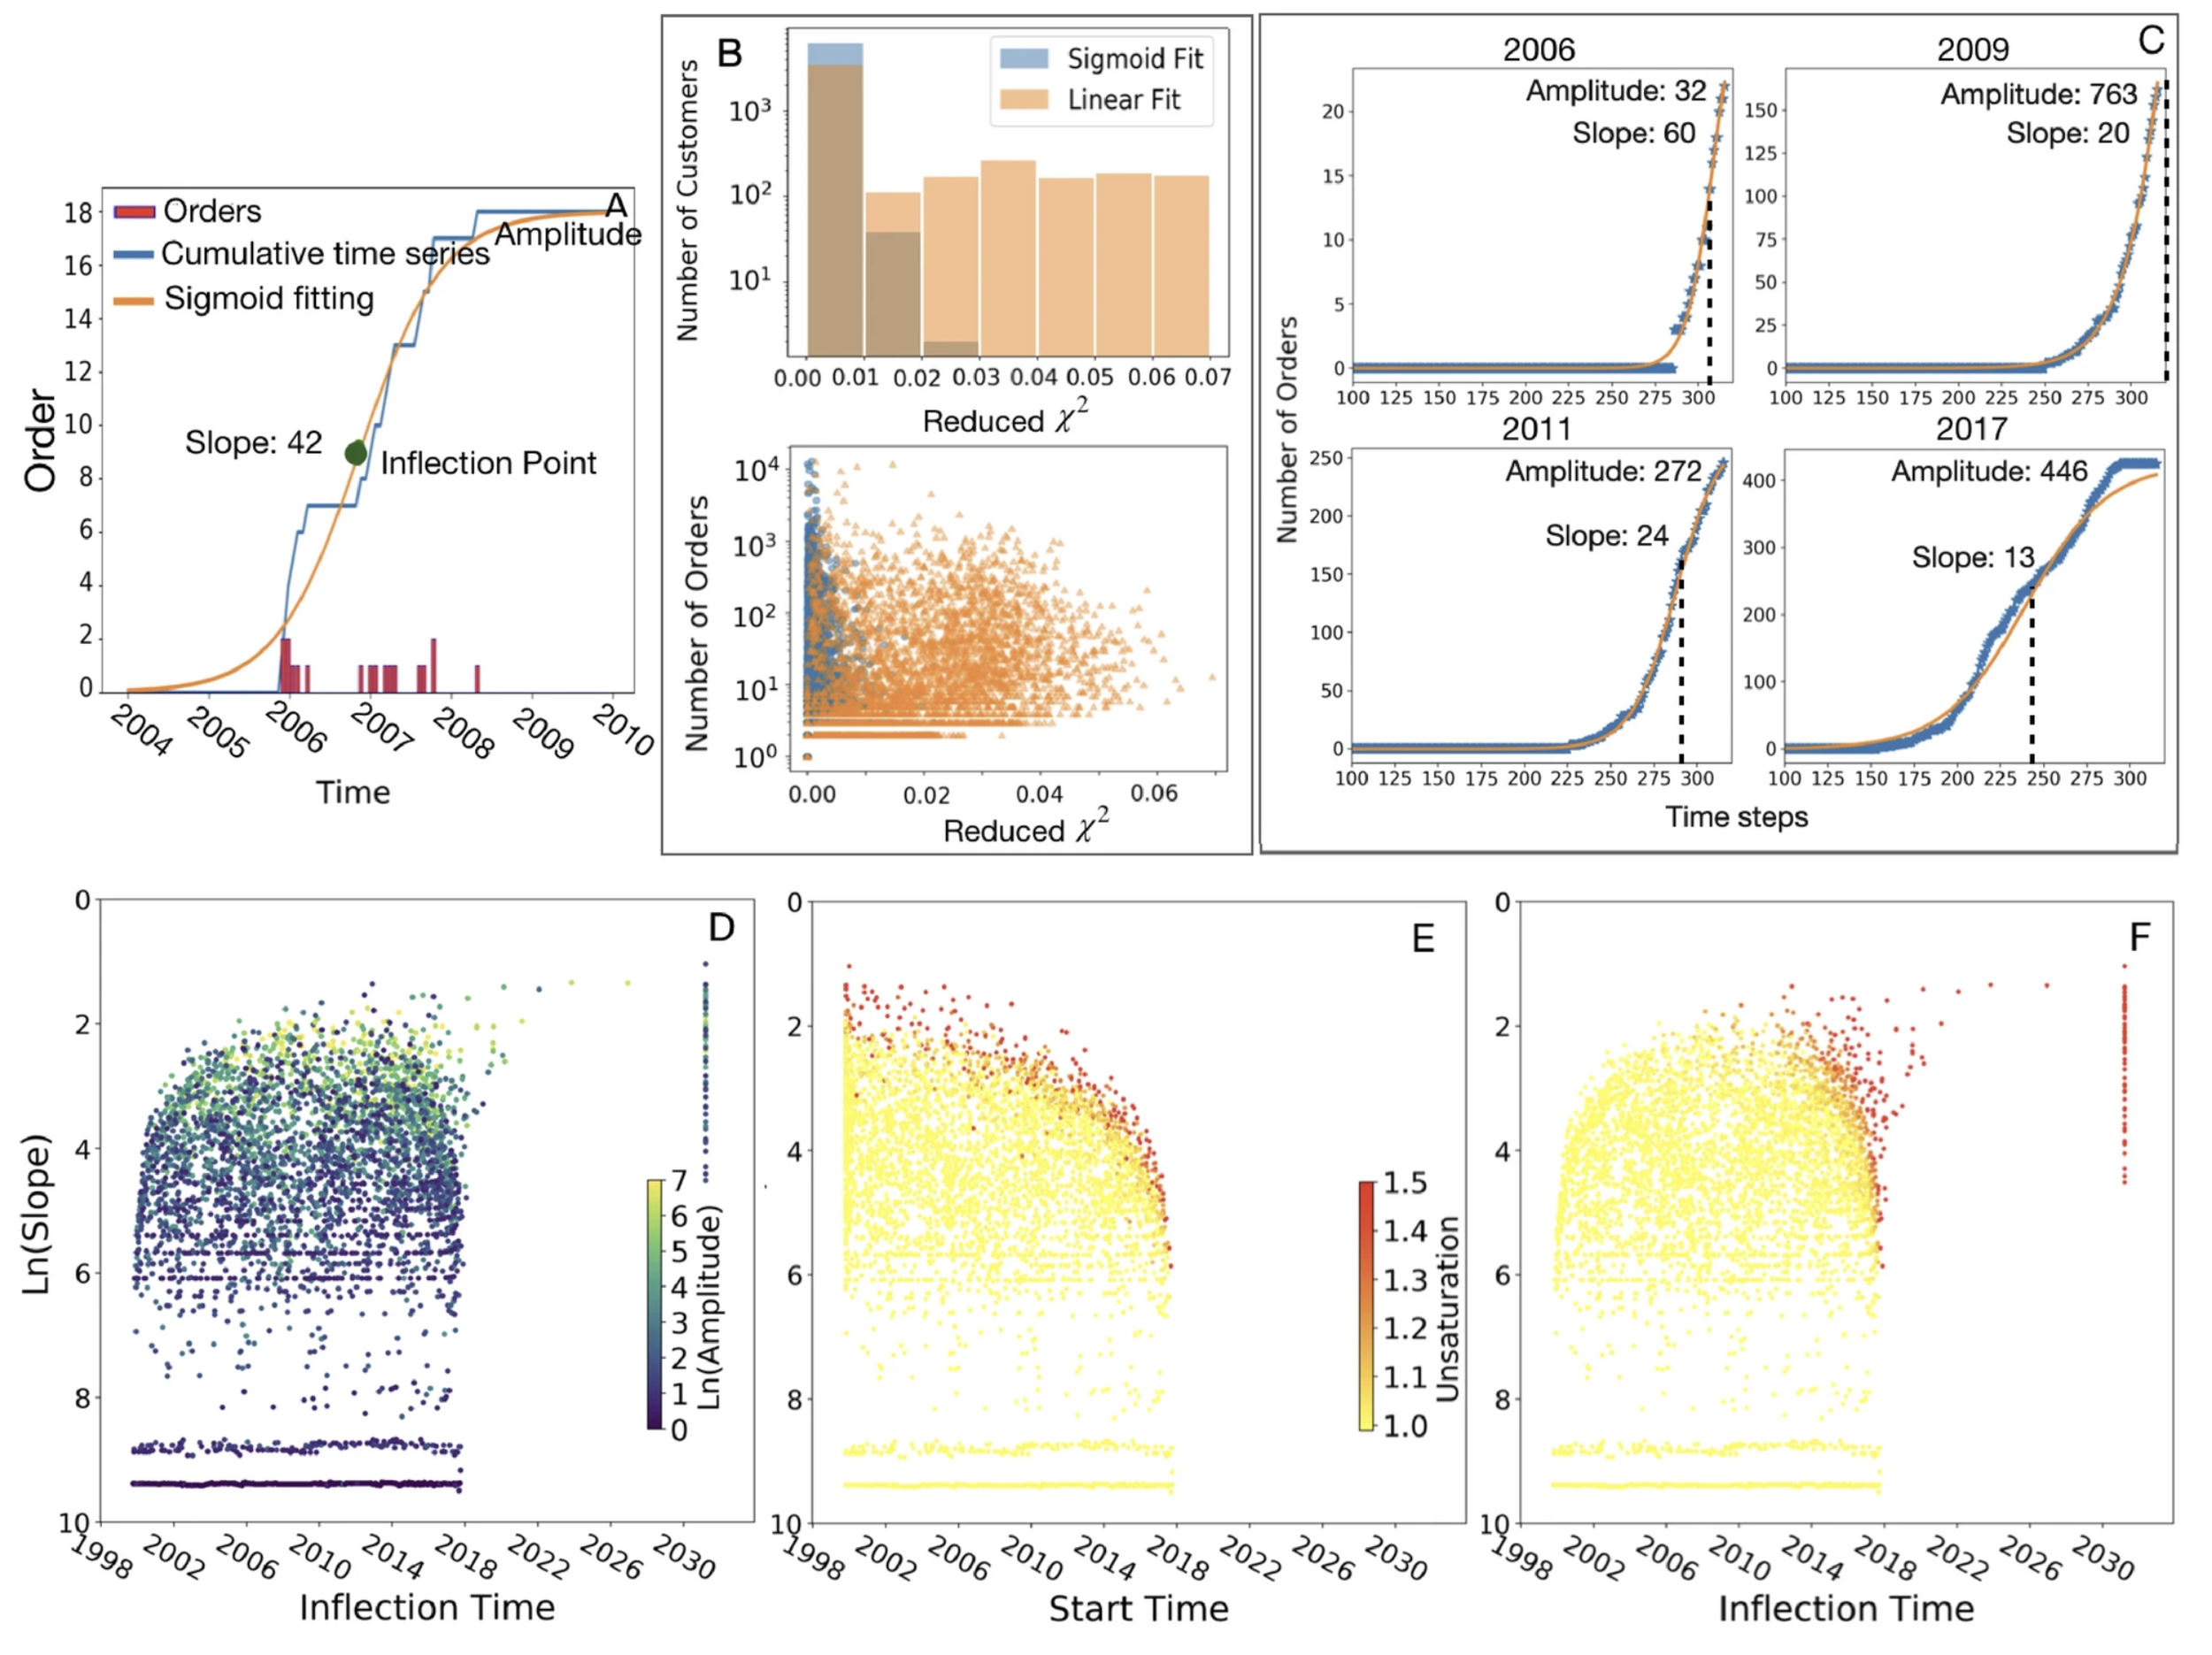
Sigmoid curve fitting and parameter spaces for customer ordering behavior. (A) Customer time series and fitted sigmoid curve. Red bars represent the number of orders over time for a customer; the blue line is the cumulative time series; and the orange line is the sigmoid curve fitted to the cumulative time series. Sigmoid curve parameters include inflection time (green dot, center), slope of the curve at the inflection time, and amplitude or total orders. (B) Comparison of the linear and sigmoid fits to the customers using the reduced test. (C) Ordering behavior of a representative customer in different years and the fitted sigmoid curves and their parameters. Parameter spaces for all customers are shown for (D) slope, inflection time, and amplitude, (E) slope, start time, and saturation status, and (F) slope, inflection time, and saturation. The third parameter is shown in color (scale in inset). For the customers that are early in their growth, the inflection time and amplitude are not reliable, so we assign them an arbitrary inflection time of 2030 with their last total orders as amplitude.